Advice: Develop Products for the 98%

Here’s some project management advice: And I’m going to complain a bit…  Hope you don’t mind.  🙂  I notice user interface design – especially in software products.  I notice menu placements, dialog box layout, screen widgets, and everything else.  And there’s one thing that always bothers me.

    Complex products seemingly designed for 2% of the intended users – %*^$*#

Developers fall into a common trap: adding too many menus and screen gadgets.  Here’s how it happens…  Sales managers, product managers, and CEO’s all want products to do something new.  Something big and flashy.  Something they can sell.  So, they call down to the developer’s cubes to make it happen.  And it does!  Unfortunately, so do dozens of other feature requests.

Developers often don’t know how to bury the obscure features and highlight the common stuff.  Everything is given equal weighting in the user interface.  That’s okay until you have a hundred big features.  And then everything runs together.  Users see so much stuff, they can no longer gear the product to their own purposes.  It takes a Masters degree to figure it all out.

A better approach is to develop the product for the 98% of customers who will use it.  In other words, MAKE IT SIMPLE!  Bury the features intended for the other 2%.  That doesn’t mean you’ll only bury 2% of the menus and dialogs because normally about 50% of the product falls into the “obscure” category.  Bury all that, and explain it to the 2% who need it.


–ray

CIO: Are You Involved?

CIO Insight had a short article that got my attention.  See the link below.  It caught my attention because it lists the business areas where CIO’s are not typically involved.

http://www.cioinsight.com/c/a/Foreward/What-IT-Leaders-Dont-Do/

Areas CIO’s are not involved: 

  1. Choose geographical markets to enter
  2. Choose product markets to enter
  3. Choose product lines to enter
  4. Hiring non-IT employees
  5. Acquiring other companies
  6. Merging with other companies


I’d like to hear your opinion!  Should CIO’s be involved in these areas?  The first three are the domain of sales and marketing executives, and the last three belong to the CEO (who the CIO normally reports to).  So what involvement should the CIO have in these areas?  I would think little, if any.

CIO’s typically care about the information infrastructure of their organizations.  So how do these things apply to that.  Well, there’s web sites, databases, web services, network traffic, logins, etc, etc, etc.  I suppose that’s a fair degree of overlap.  But does it warrant anything more than a token seat at the conference table (when discussing the issues)?

Your thoughts?


–ray

Define: Resource Allocation

 Resource Allocation: The assignment of project tasks to employees over a specified time frame.

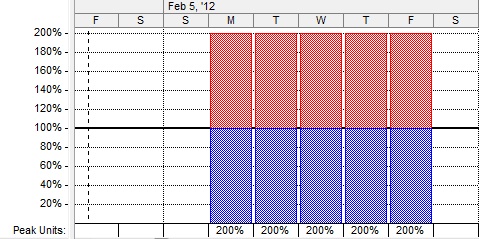
The chart below (taken from Standard Time®) shows an example of tasks allocated to one employee over three months.  The blue bars are correctly allocated time.  Yellow means there are not enough tasks, and red means there are too many.

So what does ‘correctly allocated time’ mean?  It means that a project manager has lined up project tasks for an employee to work on, but has not given too many or too few.  There are ‘just enough’ for the employee to complete in a given time.  The 63 hour week below is as unworkable as the 10 hour week.  Anything within 10% of a 40-hour week works.


Resource Allocation Chart


–ray

Raising the Flag the Marine Corps Way

I picked up a neat little business management book named “Semper Fi, Business Leadership the Marine Corps Way.”  The web address is below, in case you’d like to check it out.


http://www.semperficonsulting.com/

The philosophy of the book is to run your business like the Marine Corps.  Does that mean scream bloody murder into the faces of your new recruits?  Only if they need it.  🙂  No, it simply outlines the Marine Corps way of running its operation and the parallels to business management.  Here’s a quote from the book.

In Officer Candidate School, there is a famous exercise in which the prospective officers are given the assignment of raising a flag pole so that it meets a number of detailed specifications.  It is assumed in the exercise that the officer has one sergeant and two privates to assist him.  The instructors are constantly amazed at the ingenuity of the trainees, who have come up with a thousand and one ways to erect that flagpole.  What the instructors are looking for, however, is a much simpler answer: “Tell the sergeant to raise the flagpole and walk away.”

The point of the exersize is to delegate to subordinates.  The sergeant can figure out the details on his own.  And, if they are very detailed, he can present his plan to the officer before proceeding.  This leaves the sergeant to get the job done, and the officer free to strategize the next steps.  Everyone has his job to do, and things move efficiently.


–ray

Advice: Track Project Time

Project management advice: Track your project time.

Organizations perform projects for a lot of reasons.  Consulting companies perform the same projects (often with small changes) for every customer.  Manufacturing and engineering companies build things, requiring complex engineering projects.  Government organizations perform IT and data processing projects.  Every one of these can benefit from tracking project time.

Whether you use a timesheet or computer-based timer, tracking your time provides several advantages.  Some managers have no real idea how long their projects take.  They have a gut-feeling, but no hard numbers.  And trusting your gut only works when steeped in actual numbers from the field.

No more guessing
WIth actual numbers behind you, there’s no need to guess.  You have the hard facts, and they cannot be disputed.

Accurate finish dates
Assuming you have have performed a similar project in the past, setting a finish date will be a no-brainer.  You’ll have details to back up your outrageously long schedules.

Concise records
This is crucial for consulting companies.  Client billing depends on accurate numbers to back up your invoices.  But manufacturing and engineering groups also need good records to back up their project cycles.  In the end, clients and managers want to know what you have been up to.


–ray

Scrum Burn-Down

Have you ever used a scrum burn-down chart?  Funky name, huh?  It’s actually a pretty handy line chart.  The image below is an example from Standard Time®.  There, it’s called a project history chart. On the X axis, you see time (weeks, months, quarters).  On the Y axis (vertical) you see the number of remaining hours for your project.  As work is applied to the project, it burns remaining hours down to zero.  Team members can see the downward trend and predict when the project will finish.  This is the “light at the end of the tunnel” chart that helps people push for completion.  Show this in your scrum sprint meetings, and your team members will take heart.   Scrum Burn-Down Chart  As you can see, there are some up-ticks as well.  Those represent project scope changes.  Some bright individual decided the project needed a slowdown, and added some additional tasks.  Do that at your own peril, because this chart shows all. –ray

What’s In It For Me?

Something finally occurred to this week.  People care (mostly) for themselves.  I’ve been observing some people recently, and have noted their project participation.  When there’s something in a project for them personally, they go gangbusters to finish it.  And when there’s nothing, they lose interest and quit.  At least, mentally that is.  Be it financial gain, or street cred, or just looking good.  There must be something in it for them.

I may be a little slow, but I had never really studied this aspect of human behavior.  I just thought people worked hard for their company and that was that.  Not so.  They work strictly for themselves.  And now that I look back on my career, I see the same pattern.  My own career was carefully crafted to climb the ladder of success.  If a project didn’t fit that model, I found a way out.  If it did, I worked it for all I was worth.  I wasn’t greedy with my time, but eventually gravitated toward projects that benefited me.  That’s not selfish, it’s just natural.

Knowing that gives me something to work with.  It means I must find ways to help people succeed in the projects I expect their help with.  I must find a clear benefit for each team member.  If there’s nothing in it for them, I should expect them to grow disinterested and mentally quit.  Sounds like a real challenge!


–ray

My Manager, When Projects are Late

Being consistent in your management style and personality is important for success. One of the first lessons in parenting is being consistent.  If you discipline your child one time for something, but then ignore that same thing a different time, you are sending a confusing mixed message.  Obviously, your project team members are not children, but the principle still applies.

Our teams depend on us for leadership and direction. As managers, if we are on a roller-coaster of emotion, our project teams will be all mixed up.


My manager when projects are late

Inconsistent behavior stifles creativity and does not allow a tolerable environment for ideas to be exchanged.  If a team member is not sure how you will react from one day to the next, they are less likely to be forthcoming with ideas and suggestions.

No matter how crazy a project becomes or how much stress leaders are under, we must be the model of consistency.  Like the commercial says, “never let them see you sweat.”


–Warren

Define: Feature Creep

Feature Creep: Small product feature additions that unexpentantly expand a project scope.


Feature creep is one of the big reasons projects ship late.  Some people simply cannot deny themselves.  They want more and more features in their great new product, and can’t stop adding them  Here’s how it happens.

When a new product feature is complete, there are oohs and aahs from all the project stakeholders.  They love it!  Why?  Because they are sure customers will find it useful and reward the company with more business.  That’s only natural.  But then something else happens…  One of the stakeholders steps up and says, “That’s cool, but can it do one more little thing?”

All the other stakeholders agree.  The new feature you added is nice, but the product should do one more thing to be complete.  And they may be right.  So you add that.  And a few more things.  And a few more things after that.  That’s feature creep.

Little additions creep into your product features until they consume a major part of the project timeframe.  The extra features are nice, but can you afford the extra time?  After all, you now have less time to implement all the other cool features you were asked to do.

Stakeholders often don’t understand this problem.  Later, they’ll come around and ask why your project is behind schedule.  You can’t say that it’s because of all the little things they asked for.  Why?  Because they won’t remember those or they don’t see them as a major time sink.  See the problem?  You can’t win with feature creep.  🙁


–ray

How To: Calculate Costs in Microsoft Project

This post will illustrate how to calculate costs in Microsoft Project.  As you will see below, each tasks has a total cost and an actual cost.  The actual cost are those costs that have actually been incurred during the execution of the project.

Costs in Microsoft Project and Standard Time® are very different.  Each task in Microsoft Project may have an arbitrary dollar value.  We’ll assign some below to demonstrate.  This is not true of Standard Time®.  Standard Time calculates task costs by multiplying hours times rates.  (C = H * R)  There are various rates a project may have, but the formula is always true.  Microsoft Project is different.  Follow the steps below to calculate costs in MSP.

Create some tasks:

  1. Add a task named “Task 1”
  2. Add a task named “Task 2”
  3. Set the Duration to 100h and 40h respectively
  4. Remove all columns by the Duration column (right-click and choose Hide Column)


The results look like this:


Insert the following columns:

  1. Cost
  2. Actual Work
  3. % Complete
  4. Actual Cost


The results will look like this:


Microsoft Project Cost Fields


Experiment with the Duration, Cost, and Actual Work fields, and you will see updates costs values.  The image below illustrates this.


Updated Microsoft Project Cost Values

–ray