Define: Preleveled Start

Preleveled Start: The starting dates of all tasks in a project plan before a resource leveling operation was performed.

If you use the resource leveling feature in Microsoft Project, you might consider adding the “Preleveled Start” and “Leveling Delay” columns.  These two columns help explain the effects of a leveling operation in MS Project.  The Preleveled Start field shows the dates that the tasks were before the level, and the Leveling Delay tells the amount of time each task was shifted to avoid over-allocation.

Consider the screenshots below.  They demonstrate the Preleveled Start field and Leveling Delay.

The first screenshot shows the fields before the resource leveling operation.  In this example, we have two tasks that occupy the same calendar date range.  Obviously the resource cannot complete both tasks at the same time.  We must move one, or split the tasks so they both can be completed.  But here you have a decision to make… can the resource multitask or must the second task follow only after the first has been completed?  Certain tasks like “Foundation” and “Framing” and “Roofing” cannot be multitasked.  They must be completed in sequence.  In this case, the normal leveling choices are best.

Preleveled Start before leveling
Preleveled Start is NA before leveling


In actual life, the resource will probably multitask both project tasks, which has the effect of pushing them both out.  The screenshot below shows the resource working 50% of his time on both tasks.  That doubles the amount of time the tasks take, but allows the resource the luxury to spend whatever time they want on the tasks.  This only works when the tasks are not mutually exclusive.  In other words, the second task can be performed at the same time as the first.  Or, they don’t have to be performed serially.

Resource at 50%Multitasking means working both tasks during the same calendar date range
 

But if you really want to use resource leveling, you’ll find that MS Project pushes one task out past the first one to that it starts when the first one ends.  Use this approach when you cannot work on the second task until the first is completed.  In other words, multitasking is not possible for these two tasks.  The screenshot below illustrates this.

Preleveled Start after leveling
Results of Leveling: Preleveled Start and Leveling Delay


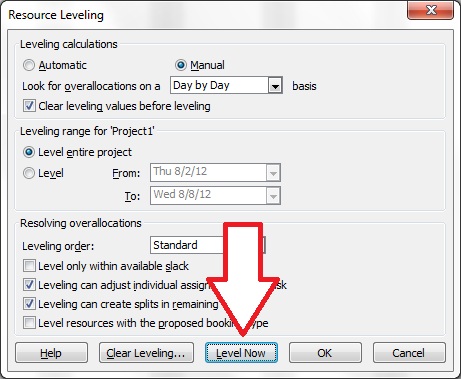
Follow these steps to level resources:

  • 1. Choose Tools, Level Resources…
  • 2. Click Level Now

This dialog box is displayed to help choose the leveling options.

Resource Leveling Options 

Project Management Doesn’t Have to be Hardcore

When most people think of project management, they think of crusty PMI propeller-heads sitting in a back office analyzing complex columns of project metrics and arriving at lofty strategic conclusions.  (Did I pitch that nerdy enough?)  In other words, project management is out of most people’s realm of understanding.

But it doesn’t have to be that way.

Consider a simpler model, as demonstrated by the videos below.  The stuff I’m seeing here is simple – something any average manager can wrap their brains around.


How to Read a Gantt Chart:
http://www.youtube.com/watch?v=E-GZLfFPWvI

Project Management:
http://www.youtube.com/watch?v=E26M3Igh204

Resource Allocation:
http://www.youtube.com/watch?v=K-qfsuft6Ak


Really, this is pretty simple project management.  From what I see, you’ve got a simple hierarchy of tasks that employees can track time to.  For each task you set up an estimated duration that you think the task will take.  Then you release it to the wild for employees to enter time against.  When they do, it puts the actual work into the task so you can compare it with the estimates.  Pretty simple so far… no propeller beanies required.

Another video showed how you can give each task a starting date that tells when employees should work on the task.  Since you have a duration for each task, and you have a proposed starting date, you can then see how much work has piled up for any given employees.  After all, you are telling how long and when his work should occur.  The video shows a nice graph telling how much work is scheduled for each time period (week, month, or quarter).  It may have a fancy name (resource allocation) but it’s really pretty simple from my perspective.

Why not give these tools a try?  You don’t have to be a propeller-head to set up a few tasks and start tracking time to them.  You don’ t need a degree in project management or sit in a PMO office with all the bean counters.  To me, this looks like project management for the non-project managers.

You don’t have to be hardcore to manage a few tasks.  Give it a try!

Improve Task Estimates, Multiply by Pi

Trouble with poor task estimation?  Introducing the three-point estimating technique.  This might help.

Te = (To + 4Tm + Tp) / 6

Here’s the problem: engineers are never good at estimating task durations.  Not even close.  When asked how long their tasks will take, they usually just say, “They’ll be done when they’re done!”  As a project manager, you have to coerce an estimate out of them.  And then multiple by Pi for the real number.  But there may be a better way.  Read on for a possible solution.

Example:

                It’ll take about two and a half months.

                Multiple by Pi

                Result: eight months

First off, Engineers just don’t like estimating time.  They have technical issues to deal with, and are not practiced in the arts of time estimation.  They feel uncomfortable in fuzzy areas like this because they don’t spend any time thinking about such things.  The traffic in mathematical and logical conundrums, not project scheduling.  You might just as well ask them how much their tasks will cost, or how much the company will make from the product, once marketed.  It’s just not something they spend any time considering.  That means you have to take their task estimates with a grain of salt, or perhaps with a more scientific calculation.

What could be more scientific than multiplying them by Pi?  🙂

The three-point estimate technique below first appeared with PERT (Program Evaluation and Review Technique).  It has some merit when dealing with task durations, and might be more accurate than multiplying engineer estimates by some arbitrary number.

Start by taking this three-point estimate below from the engineer for each task.  You must get them to tell you the most likely duration for each task, which they will understate by a longshot… then you must try for an optimistic estimate, which they will assert is the same as the first estimate… then finally you have to get them to spit out a pessimistic duration, at which point they will argue is also the same as the first two, and that you are stupid for asking… now go away!  But if you can get these three numbers, you can plug them into the three-point estimate calculation below.

  • 1. Tm – Most Likely estimate (example: 6 months)
  • 2. To – Optimistic estimate (example: 4 months)
  • 3. Tp – Pessimistic estimate (example: 12 months)

With these three estimates, you can run a calculation to find the mean estimate.  (Find this calculation on page 150 of the PMBOK.)

                Te = (To + 4Tm + Tp) / 6

                Example: (4 + 4(6) + 12) / 6 = 8 months

The results are a good prediction of human estimations, assuming that most people under-judge the duration of most tasks.  They simply forget or don’t consider all the possible details in executing their assigned tasks.  This calculation makes up for that lack of detail.

Hope it works for you!

Define: Resource Breakdown Structure (RBS)

Resource Breakdown Structure (RBS): A hierarchical listing of resources necessary to complete a project.

Project resources are commonly thought of human resources only.  In other words, only the people that will actually work on the project tasks.  But that is not necessarily the only type of resource list that can be compiled.  In fact, the RBS can include both human resources and physical resources, like computers, software programs, timesheets, tools, instruments, automobiles, or even special clothing.

As seen below, the hierarchy is entirely project defined.  Any leveling applicable to the project can be used.  Examples might be organizational chart, or tool type, or physical location, or even sequencing by use.  Any useful project breakdown is appropriate.

Traditionally, only non-expendable resources are included.  Expendable items such as water and gasoline would not be listed.  These would fall into the category of supplies rather than resources.

Example of hierarchies of resources:

1. Engineering
  1.1 Rob
                2.2 Ted
                1.3 Software
                                1.3.1 Bill
                                1.3.2 Joe
                                1.3.3 Standard Time® Timesheet (timesheet and project tracking software)
                                1.3.4 Microsoft Project (project scheduling)
                                1.3.5 SQL Server (database)
                1.4 Hardware
                                1.4.1 Alice
                                1.4.2 Jill
                                1.4.3 Test Stand A
                                                1.4.3.1 Computer
                                                1.4.3.2 Wiring harness
                                1.4.4 Test Stand B
                                                1.4.4.1 Computer
                                                1.4.4.2 Wiring harness
 

The example above includes both human and inanimate physical resources, like software and test instruments.

Notice the numbering nomenclature.  The hierarchical list is numbered, with each indented layer adding another level to the numerical label.  Examples: 1.3, 1.3.1.  This makes each resource uniquely identifiable by numerical label.

How Buggy is your Product?

Want a really slick way to find out how buggy and nasty your product is? Buggy? Who wants to know that? We want good products, not buggy ones. Well, this method will help you get there. It’s a way to find out how many bugs there are still in your software when you release it.
Let’s face it, all products have bugs. Even fully released and supported ones. But managing the number of bugs at launch time is a good thing. Release too many, and you’re dead. Tech Support will hate you; your CFO will hate you, and worst of all, your customers will hate you. So clean things up, buster!

Here’s how you do it:

Let’s first start by supposing that you have a QA department testing your product prior to release. They test the documented and “undocumented” features of the product, record and report the bugs, then retest when engineers fix them. Hopefully, the product becomes more robust as the release date approaches. Less and less bugs are found. But we all know the product will ship with some known and unknown bugs. You just can find them all, and you can’t always fix the ones you find. But the process is good, and it’s working fine.

So, what if you intentionally slipped some known bugs into the product, hoping the QA department would find them? If you did, you’d know they were doing their jobs. After all, that’s what they are paid to do. So for instance, if you were receiving 1,000 bugs per week from the QA department, and you slipped 100 new bugs into it, you would hope to get 1,100 bugs the next week. You would know the Quality Assurance department was catching 100% of the bugs in the product.

But what if the QA department only found 70 of your artificially injected bugs? I.e. the ones you inserted just to test the percentage of bug found. If only 70 of the inserted bugs came out, that would tell you that their efficiency rate is about 70%. Given that they find 1,000 bugs per month, you might suspect there are actually 1,428 in the system. Why? Because they only found 70% of your artificial bugs, so what makes you think they are finding 100% of the others? Probably not, but that’s okay; nobody’s perfect. If they are 70% efficient, then 1,428 x 70% = 1,000.

Using this method, as your bug rate approaches zero, you’ll know about how many uncaught bugs remain.

Closer to the Source

The sooner employees record actual hours worked, the more accurate they will be.  Some companies require team members to record their project hours.  Sometimes this is for client billing, other times for engineering or manufacturing projects.  Whatever the reason, I’ve seen firsthand that recoding hours soon after the actual event ensures accuracy.

Most people cannot remember what they did last week.  So if asked to fill in their timesheet for last week, they will not be able to pick out individual tasks.  Sure, they remember which projects they worked on, unless there are more than two.  But they cannot reliably remember which tasks.  It gets impossible when asked to assign actual hours to those tasks.  That is the primary reason DCAA (Defense Contract Audit Agency) requires timekeeping every day.  Even filling out timesheets at the end of the week is against the rules.  I don’t normally like government agencies, but in this case there is truth to their overbearing policies.

Standard Time® is an example of a professional timesheet with a built-in timer.  The image below illustrates the Quick Task window.  A link to a video is also included.

Prototype

Standard Time® Quick Tasks

In the Standard Time Quick Task window, you simple click project tasks to start and stop the timer.  Time log records are automatically entered into the timesheet.  That solves the problem of entering hours after the work is finished.  Actual work is sent directly to the timesheet; there is no delay.  And since you are clicking the checkbox to start and stop a timer, the actual work is as accurate as it could possibly be.

Most companies do not require minute-by-minute accuracy, unless you are charging them for time worked.  Only consulting companies really need this level of granularity.  For them, it’s much easier to justify invoices when the time accounting accuracy is beyond impeachment.  Simply print out the actual time log report (with records down to the second) and there is no disputing the accuracy.  Of course you can still milk the clock, but consultants are rarely accused of that.  But still most manufacturing companies that track projects for earned value purposes don’t need timer accuracy.

Whether your company needs timer accuracy, daily accuracy, weekly, or monthly, tracking time is almost always a good thing.  There is so much value in knowing how much time projects take.  Consider a few good reasons: comparing estimates to actuals, estimating future projects, assigning cost and estimates to new activities, or even know what employees are up to – all good things!

When to Re-baseline Your Project

Baselining is the act of recording your original project estimates so you can compare them to actual results at a later time.  It is also the platform from which the project is conducted.  In other words, the baseline contains schedule and cost numbers used by the project team throughout the entire process.  By baselining the project, you are laying the foundation on which the project will rise.  That’s a nice thing to have.  Employees want a good solid plan that doesn’t wander from whim to social whim.  They want a visible goal that isn’t ducking and weaving out of sight every week.  Such a goal offers reassurance and confidence for success.  A moving target is the worst motivation killer known to man.

But sometimes you just need to start over.

Yes, a moving target is a sure killer.  But there are times when the baseline is just crap.  The schedule has become irrelevant, costs are laughable, and the project team is floundering in a sea of mud.  Nothing is going as planned.  Designers are throwing in new requirements that were heretofore unheard of.  Executives are MIA.  And managers have you working 80 hour weeks to hit a target they have no clue of the purpose of.  Nobody’s admitting they’re stupid, but it’s obvious everybody is.  It’s only years later that everyone can look back and shake their heads at the calamity.  But while you’re in the midst of it, you just keep buggering on.

It is those times that executives, or maybe a strong-willed project manager needs to step in and call a hiatus.  But who’s got the guts for that.  Again, you’ve got to be a strong person to blow the whistle and wave your arms.  But if you can recognize the signals, a re-baselining during a mess like this may be your only option.

I was on a two-year software death-march like this.  It was a disaster.  Nobody knew the warning signs.  Nobody blew the whistle.  Nobody re-baselined.  The product failed six months after release, which was at that time a year overdue and marketplace irrelevant.  It was the worst project I was ever on.

Here is a good rule of thumb for knowing when to rebaseline:

Baseline the project if you have missed over half your scheduled targets in the last six months.

Have you missed a few end-to-end tests?  Missed a customer drop or two?  How about a major milestone?  Missed a target feature?  These are the warning signs.  Again, if you have missed over half your targets in the last six months, rebaseline.  Don’t try to figure it out, just baseline the project again.

In fact, in cases like that above I would suggest cutting the scope in half.  Cut the project into smaller phases.  Get the schedule down to visible goals.  And if anybody disputes them, cut them again.  And then again.  You must have realistic goals or you will fail every time.

Earned Value: 50% Fiction and 50% Fact

In project management, there is a term named “Earned Value.”  It prevents the value your project has actually earned based on its current state of completion.  The graphics below help describe this.

A close relative to Earned Value is Planned Value.  It is the monetary value the project should have generated at any point in its state of completion.  Ideally, Earned Value and Planned Value should be identical.

And another close relative is Actual Cost.  It is the cost the project has incurred at its current state of completion.  When Earned Value and Planned Value and Actual Cost are all equal, the planets have aligned!  But when they are not, we have discrepancies which we’ll explore below.  That may help explain the post title: “Earned Value: 50% Fiction and 50% Fact”.

The 50% fiction is Planned Value.  The 50% fact is Actual Cost.  Earned Value is somewhere in the middle.

Prototype


Here is an example of a discrepancy between Earned Value, Planned Value, and Actual Cost.  The Earned Value is much less than we expected, and the Actual Cost is much more.

Prototype


In this example, we see Earned Value at $30,000, but it should be $40,000.  We also see the actual costs on the project to be $45,000.  It turns out there are calculations to help normalize and judge the value of these numbers.  This let you compare the numbers with other projects to see how close you have come to historical numbers.  If you miss the Planned Value mark, the difference is called a variance.  Variance simply means you varied from your target by some amount.  There is a schedule variance and cost variance.  Of course ideally, we want these to be zero.

Schedule Variance (SV) is Earned Value minus Planed Value.  Cost Variance is Earned Value minus Actual Cost.  The equation is below.

SV = EV – PV  ($30,000 – $40,000 = -$10,000)

CV = EV – AC  ($30,000 – $45,000 = -$15,000)

In addition to variance, you can view the discrepancies in terms of ratios.  They are actually more helpful to compare with other projects because they normalize all the numbers to a single comparable performance value.

The Cost Performance Index is the ratio of Earned Value to Actual Cost.  The Schedule Performance Index is the ratio of Earned Value to Planned Value.

CPI = EV / AC  ($30,000 / $45,000 = .67)

SPI = EV / PV  ($30,000 / $40,000 = .75)

Any Cost Performance Index number over 1 is over budget.  Any Schedule Performance Index over 1 is “over schedule.”  See how these performance numbers could be helpful?

In this case, the Cost Performance Index is 67% efficient.  In other words, the project made 67 cents for every dollar expected.  That’s not good.  But maybe the next project will be better!


ASPE PMP Boot Camp Day 4 (Last Day)

It’s Thursday afternoon, and I’ve finished the Project Management Professional (PMP)® Certification Exam Boot Camp hosted by Dave Caccamo at ASPE and I’ve decided that it’s not a real Boot Camp because we didn’t fire any guns.  I blame ASPE for the misleading title.  🙂 

So aside from that little misunderstanding, I’d definitely go with the Boot Camp title – this is hardcore!  If you like hardcore, get in on this course.  If you don’t, maybe you can pass the PMI PMP Certification Exam on your own.  Good luck with that!

Actually, I thought of doing that very thing about two years ago.  I researched the PMI PMP exam, and strongly considered signing up for it.  I figured I knew enough about project management to pass.  Heck, it was probably just a bunch of terminology and best practices, right?  I knew that stuff and figured I could pass.  Now after taking this course, that idea seems so laughable.  I probably would have had about a 1% chance of having my application accepted, let alone passing the exam.  There is so much I didn’t realize about PMI and their PMP exam and their expectations of project managers.

This course enlightened me considerably.

We spent the last day finishing up the 42 PMI project management processes.  That included those from the Executing, Monitor and Control, and Closing process groups.  This is where the Initiating and Planning processes are performed.  After finishing those, we took a final test quiz and finished out the course.  Anyone with a low 70’s grade on the final quiz should feel comfortable moving forward with the PMP exam after a reasonable study period.  So I guess I’m good.

I have to say, even though we stuck closely to the PMI processes, this classroom offered a perfect setting for a wide range of project management topics.  It wasn’t all PMI Process Heaven.  All the methodologies  came out eventually, with comparisons to PMI – the good, the bad, and the ugly – and how real-world PM’s get things done.  So felt I grew a little outside the sanctioned course material.

One thing to stress is that you cannot come riding into this course on your high horse.  Don’t think you are going teach everyone how wise you are in the world of project management.  Get ready to submit yourself to the PMI method, even if you disagree with it.  There just isn’t time to argue platitudes.  You’ll miss the whole point, and likely ruin your chances of passing the exam.  Stick to the subject matter and you’ll be farther ahead.

I hope you have enjoyed the series.  I offer my sincere apologies to those in the PMI world for oversimplifying, misunderstanding, and perhaps misrepresenting the material.  Again, this was my personal experience of going through the PMP Certification Exam Boot Camp.  You’re seeing it through my limited experience level – a complete novice to PMI and the PMP exam.  Your mileage may vary.


My Notes on Day 4 of PMP Boot Camp:

Focus on being able to write out PMBOK matrix in its entirety.

Practice PMP cert exam write-ups.  Make sure you have some experience for every process group, even if it’s light or it may not be accepted.  Must use some PMI buzzwords, but not an obvious list from page 43 of PMBOK.  Go into some detail in one or more areas, a success.  No technical details, no technical lead.  All details should be PM related.  Connect PMI processes to show project success.  If you were a team member without a formal PM title, you’ll have to come up with something related – descriptive rather than formal titles.  How you integrated processes, management deliverables.  You can still get away with a “Project Task Manager” title.

Send your PMI write-up to Dave Caccamo at ASPE before submitting.  He can tell whether it will be accepted.

Use the patterns for learning process inputs and outputs.  At this point, I know I should be doing this, but haven’t memorized the patterns, so I forget them.  I suppose I didn’t know the significance of the patterns early enough.  Pretty important, or else you have to memorize all inputs and outputs without a framework of logic.  PMI doesn’t like simplified pattern style of learning.

A spaghetti factory is what you get if you try to show flowcharted rubber band connections between all the inputs and outputs.  It’s just too complex to draw out.

Turn brain cells over to PMI.

Read PMBOK for Monitoring and Controlling (and Closing) Process Group.  Closing Process Group questions may be tricky and picky.

PMP cert pass rate is about 70%, and the average score is 72%, but PMI doesn’t publish this info.

Get the “Random Thoughts on the PMI Exam” document from Dave Caccamo.  Answers a lot of questions.

After drawing the matrix every day (before exam), name one major output to help key you during the test.


Links to previous ASPE PMP Boot Camp posts


Disclaimer: The thoughts and feedback for the ASPE PMP Certification Exam Boot Camp associated with this series of posts are my own. In exchange for providing my feedback on this community forum, ASPE has provided benefits related to my course attendance.

ASPE PMP Boot Camp Day 3

At what point during an intense technical seminar do people start to weary and tune out?  For me, that point almost came at the last hour of Day 3.  As you know from my previous posts, I’m taking the Project Management Professional (PMP)® Certification Exam Boot Camp offered by ASPE SDLC Training.  I got a direct mail piece one day, and just signed up.  So here I am in Denver, taking the class.  These are my personal experiences.

Okay… so I’ve lasted one hour shy of three days.  All is well… I’m challenged… I’m getting it… I’m filling the notepad… but I’m starting to notice a peculiar feeling not hitherto experienced… exhaustion.  Probably from burning the candle at both ends and sitting a pretty intense course.  So I guess I’ll tune out, right?  Slack off on the notes, let a few minutes of lecture gently ease over my head while I fake the Active Listening feedback.  Sure, I could have done that.

But then came along Earned Value Analysis!

Bing!  I woke right up!  The next hour (and last one of the day) flew by like the very first ones had on Monday morning.  Discussions of Earned Value and Planned Value and Actual Cost drove cobwebs from my weary brain.  Then there were formulas for Cost Variance and Schedule Variance, and then Cost Performance Index and Schedule Performance Index, and further discussions of how SPI is only a defining value when taken from the Critical Path killed off the hour.  (You gotta be a geek.)

Lesson learned: you have got to come into this class with some real interest in the project management process.  Pick a topic: Scope?  Time and Cost?  QA or QC?  How about Human Resources or Communications?  Procurement?  Pick one.  Because without some natural interest, and some serious geekology (the study of geeks), you might not survive this Boot Camp.  That’s what I realized today.  I really like some of this stuff!  Although I’m not sure why.  But when certain topics come up, my heart leaps and I drill in extra hard for all the good stuff.  I can honestly say, this course did not disappoint the geek within.  Even on the last hour of the third day (there’s one more Day to go), Dave Caccamo did not slack up.  Earned Value came forth with the same enthusiasm as Developing Project Charters and Identifying Stakeholders had on Day 1.  That was a surprise.  You would think he’d run out of steam like I had.  Nope, not Dave.

Okay, changing subjects… I really get the feeling that PMI wants to weed out the deadbeats.  A good portion of this course was raising the awareness of the heights to which PMI will go to trick exam-takers and would-be PMP’ers.  If you don’t live for this stuff, they want you gone.  The novice who has never taken a course like this would never know that… until they bombed the exam four times.  I now know about twenty ways PMI could trip me up.  Maybe that will help when sitting the exam.  Hope so.

One more thing: I would have liked one improvement.  I would somehow like to see special significance given to process inputs and outputs.  After Day 3, I realized that from the dozens of processes, lists, phrases, formulas, and methods you read through, the process inputs and outputs seem to all blend in.  You have to manually pick them out of the soup.  I found it difficult to elevate them to a higher status that would help me instantly identify even though they were clearly listed on the slides.  In other words, they didn’t stand out from the minutia.  I know that sounds dumb, because there they were on the slides and flash cards.  But it seemed like as we zoomed through the material, one list had equal standing with the next, and only by applied effort was I able to elevate the process inputs and outputs to the level they deserved for memorization.  After all, you can’t memorize everything.  You have to prioritize, and process inputs, outputs, tools, and techniques were the likely choice for me.  I don’t have any suggestions for improvement; I’m just griping.  I can do that, right?

So, there’s one more day left…  I’m excited to complete this, but I’m also weary.  Will I survive?  Yeah, I think so.  Will I tune out?  Probably not, but you never know.  But I know this will certainly stand out as a career highlight for me.  I’ve gotten more knowledge in these few days than several years’ worth.

Check out ASPE.  Great organization.


My Notes Taken on Day 3:

There are some useful “PMI thinks” rules that dictate input and outputs.  Remember these rules and you can predict the inputs to any process.  Dave Caccamo has developed these rules.  Get from him.

There are so many trick questions that you can’t list them.  Very numerous.  Plus, all the wrong answers will be common things people think of based on the trick terminology.  The subject material is hard enough without these shenanigans; tricks just put it over the top.

There are 50 “pretest” questions mixed into the test.  You won’t know which questions count toward the results and which don’t.  Pretest questions don’t count.  They are used by PMI to decide if the question will eventually be put into the real questions.

Drink the Kool-Aid.

I found it difficult to remember where each process input was produced.  Which process produced it?  Sometimes they abstracted by other process outputs.  Outputs do not always go directly to inputs.  I would like to see a computer rubber band model that traced inputs to the processes that created them.

By now memorization should be giving way to logic.  Inputs should be predictable.  Problem is, there’s so much information that needle-sized outputs are hard to pick out of the haystack.  Actually, I’m not even sure if all inputs are outputs of other processes.  Maybe some are from external sources.

Fog of war.

I admire people who hold forth well beyond my comfort level.  How do they do that?

Links to previous ASPE PMP Boot Camp posts


Disclaimer: The thoughts and feedback for the ASPE PMP Certification Exam Boot Camp associated with this series of posts are my own. In exchange for providing my feedback on this community forum, ASPE has provided benefits related to my course attendance.